[toc]
statistical reporting guide best practices for researchers
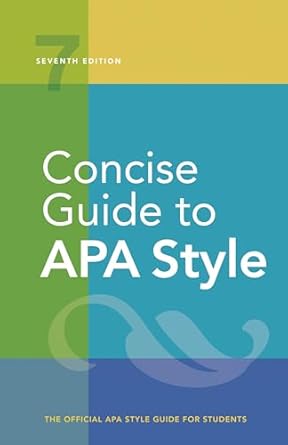
Concise Guide to APA Style: 7th Edition (OFFICIAL)
Page 148 Review
Analyzing Statistical Reporting in Research: A Deep Dive
This excerpt from an ebook provides essential guidelines for reporting statistical data in research papers.
It emphasizes clarity, conciseness, and adherence to established conventions.
Let’s break down the key points:
Reporting F Ratios
The text illustrates how to report F ratios, a common statistic in ANOVA tests.
It provides an example:
“For immediate recognition, the omnibus test of the main effect of sentence format was significant, F(2, 177) = 6.30, p = .002, est w? = .07.”
This example clearly presents the F statistic, degrees of freedom (2, 177), the F value (6.30), the p-value (.002), and the estimated effect size (est w? = .07).
This level of detail allows readers to understand the significance and magnitude of the effect being reported.
Reporting t Values
The excerpt also demonstrates how to report t values, frequently used in t-tests.
Consider this example:
“The one-degree-of-freedom contrast of primary interest was significant at the specified p < .05 level, t(177) = 3.51, p < .001, d= 0.65, 95% Cl [0.35, 0.95]."
Here, the t statistic, degrees of freedom (177), the t value (3.51), the p-value (< .001), Cohen's d (d = 0.65), and the 95% confidence interval [0.35, 0.95] are reported.
The inclusion of Cohen’s d provides a standardized measure of effect size, aiding in the interpretation of the practical significance of the finding.
Reporting Regression Statistics
The guide further explains how to present hierarchical and sequential regression statistics, as seen in the example:
“High school GPA predicted college mathematics performance, R? = .12, F(1, 148) = 20.18, p < .001, 95% Cl [.02, .22]."
This concisely reports the proportion of variance explained (R? = .12), the F statistic, degrees of freedom (1, 148), the F value (20.18), the p-value (< .001), and the 95% confidence interval [.02, .22].
This comprehensive reporting allows readers to assess the strength and statistical significance of the relationship between high school GPA and college mathematics performance.
Avoiding Redundancy and Ensuring Clarity
A crucial piece of advice is to avoid repeating descriptive statistics already presented in tables or figures.
The excerpt states:
“If you present descriptive statistics in a table or figure, do not repeat them in the text, although you should (a) mention the table in which the statistics can be found in the text and (b) emphasize particular data in the text when they aid in the interpretation of the findings.”
Instead, the text should reference the table or figure and highlight key data points that support the interpretation of the results.
Additionally, the excerpt emphasizes the importance of clarity when listing a series of similar statistics, advising the use of words like “respectively” and “in order” to clarify the relationship between the statistics and their referents.
“When listing a series of similar statistics, be certain that the rela- tion between the statistics and their referents is clear.
Words such as “respectively” and “in order” can clarify this relationship.”
“Means (with standard deviations in parentheses) for Trials 1-4 were 2.43 (0.50), 2.59 (1.21), 2.68 (0.39), and 2.86 (0.12), respectively.”
Reporting Confidence Intervals
The excerpt provides specific formatting guidelines for reporting confidence intervals:
“When reporting confidence intervals, use the format 95% CI [LL, UL], where LL is the lower limit of the confidence interval and UL is the upper limit.
Every report of a confidence interval must clearly state the level of confidence.
However, when confidence intervals are repeated in a series or within the same paragraph, the level of confidence (e.g., 95%) has remained unchanged, and the meaning is clear, do not repeat “95% CI.””
“95% Cls [5.62, 8.31], [-2.43, 4.31], and [-4.29, -3.11], respectively”
“When a confidence interval follows the report of a point estimate, do not repeat the units of measurement.”
“M = 30.5 cm, 99% Cl [18.0, 43.0]”
This standardized format ensures consistency and ease of interpretation.
It also highlights the importance of stating the level of confidence, although repetition can be avoided within a paragraph if the level remains constant.
Statistical Symbols and Abbreviations
Finally, the excerpt mentions the use of statistical symbols and abbreviations to further enhance conciseness.
This is a common practice that improves readability for those familiar with statistical notation.
Conclusion
In summary, this excerpt provides a concise and valuable guide to reporting statistical data in research.
By following these guidelines, researchers can ensure clarity, accuracy, and consistency in their reporting, facilitating effective communication of their findings to the broader scientific community.
Buy full ebook for only $18: https://www.lulu.com/shop/american-psychological-association/concise-guide-to-apa-style-7th-edition-official/ebook/product-rmzpq54.html?page=1&pageSize=4
Statistical Reporting Guide Best Practices For Researchers
Read more: APA Style Spelling Guide: Master the Rules


Leave a Reply